
Arms Exports and Military Expenditures 2013
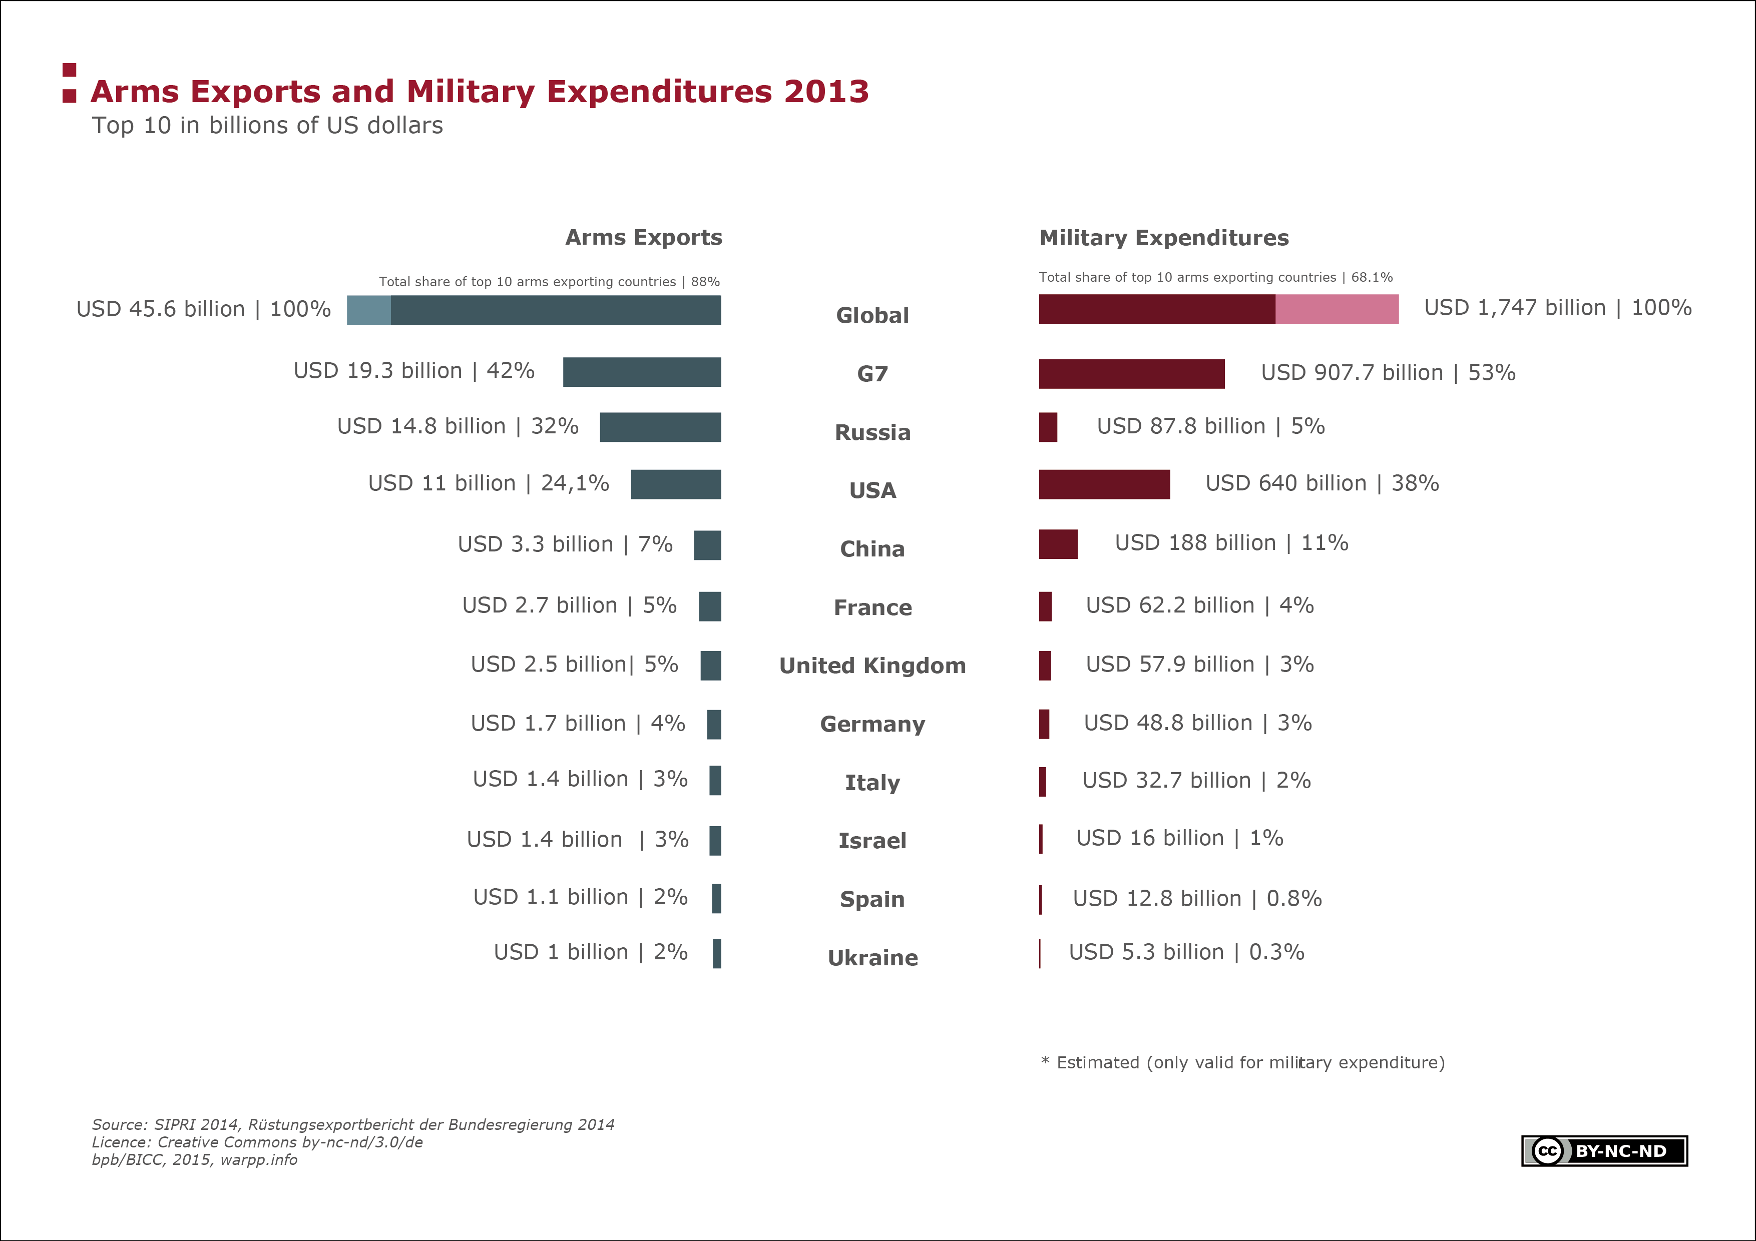
This graph represents a comparison of the highest arms exports values and military expenditures worldwide for 2015. Arms exports (blue) and military expenditures (red) are in billions of US dollars. The topmost bar showing exports and expenditures worldwide serves as a reference (100%) for the percentages of individual countries. Russian and Chinese military expenditures are estimates as these countries do not publish all expenditures.
Facts
Countries with a large and technically advanced arms industry are generally amongst the largest arms exporters. Despite the fact that these states—in absolute terms—invest the most in military resources, it is the so-called threshold countries, such as China and India, but also Russia, with a rapid growth of their national economies that have increased their military spending the most. The United States and Russia dominated the global arms market with total annual exports amounting to US 10.5 and 5.5 billion dollars in 2015, jointly accounting for 56 percent of worldwide arms exports This graph furthermore shows that the top 10 arms exporting countries dominate the global arms market with 92 percent of global exports. The United States' defence budget is also in the lead with US 640 billion dollars, followed by China with US 188 billion dollars. France and the United Kingdom, too, are amongst the top 10. In the past, these countries were most frequently involved in conflicts.
Terms, notes on methodology or reading aids
At the time of its foundation, in 1975, the G7 was the Group of Seven most influential industrial nations of the Western world. During summits, the heads of state of this group discuss global economic issues. The G7 consist of Germany, France, Italy, Japan, Canada, the United Kingdom and the United States. In 1988, the Group was expanded to include Russia (now G8). However, Russia was excluded from the summit in 2014 as a consequence of its violation of the territorial integrity of Ukraine.
The military budget of a country is generally composed of two categories. These are, for one, recurring expenditures, such as the payment of salaries to soldiers or funds needed for the maintenance and repair of military equipment. Two, so-called investment expenditures which are funds that are invested in the expansion of military capacities (for instance development), the research in and testing of new military technologies, or the purchase of new vehicles, equipment and weapons.
Data sources
SIPRI (Stockholm International Peace Research Institute) In its Yearbook, SIPRI publishes current global military expenditures on an annual basis. The data from the Yearbook 2016 are calculated with the base year 2015 and shown in US dollars. SIPRI's data are a combination of primary sources, such as data from national governments or the United Nations, evaluations of these sources as well as other secondary sources, such as newspapers and journals In doing so, SIPRI acknowledges that it is unable to paint the full picture as national military expenditures can also be listed in extra budgets and are difficult to record.
BICC 09/2016
")
")
")