
This map layer presents global arms imports for 2017 based on the trend indicator value (TIV) developed by SIPRI, measured in US dollars and classified in five categories.
Even though it is measured in US dollars, the indicator does not show the financial volume of arms transfers but gives an indication of the scope of traded weapons in comparison to other countries.

© picture alliance / Photoshot
The Arms Trade Treaty (ATT)
The international trade in weapons is only partially regulated and this regulation is based on individual contracts. One such contract is the Anti-Personnel Mine Ban Convention (a.k.a. the Ottawa Convention) (1997), which prohibits the trade of landmines, among other things.
More ...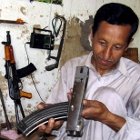
© picture-alliance/ dpa
Illegal trade in small arms and light weapons
When the media report on weapons transfers, they are mostly talking about weapons systems, such as tanks, submarines and fighter planes. There are few reports on the category of weapons known as SALW – small arms and light weapons, often referred to by their brand names Kalashnikovs, G3 or Uzi.
More ...")
")
")