
CO2-Emissions und temperature development 1970-2014
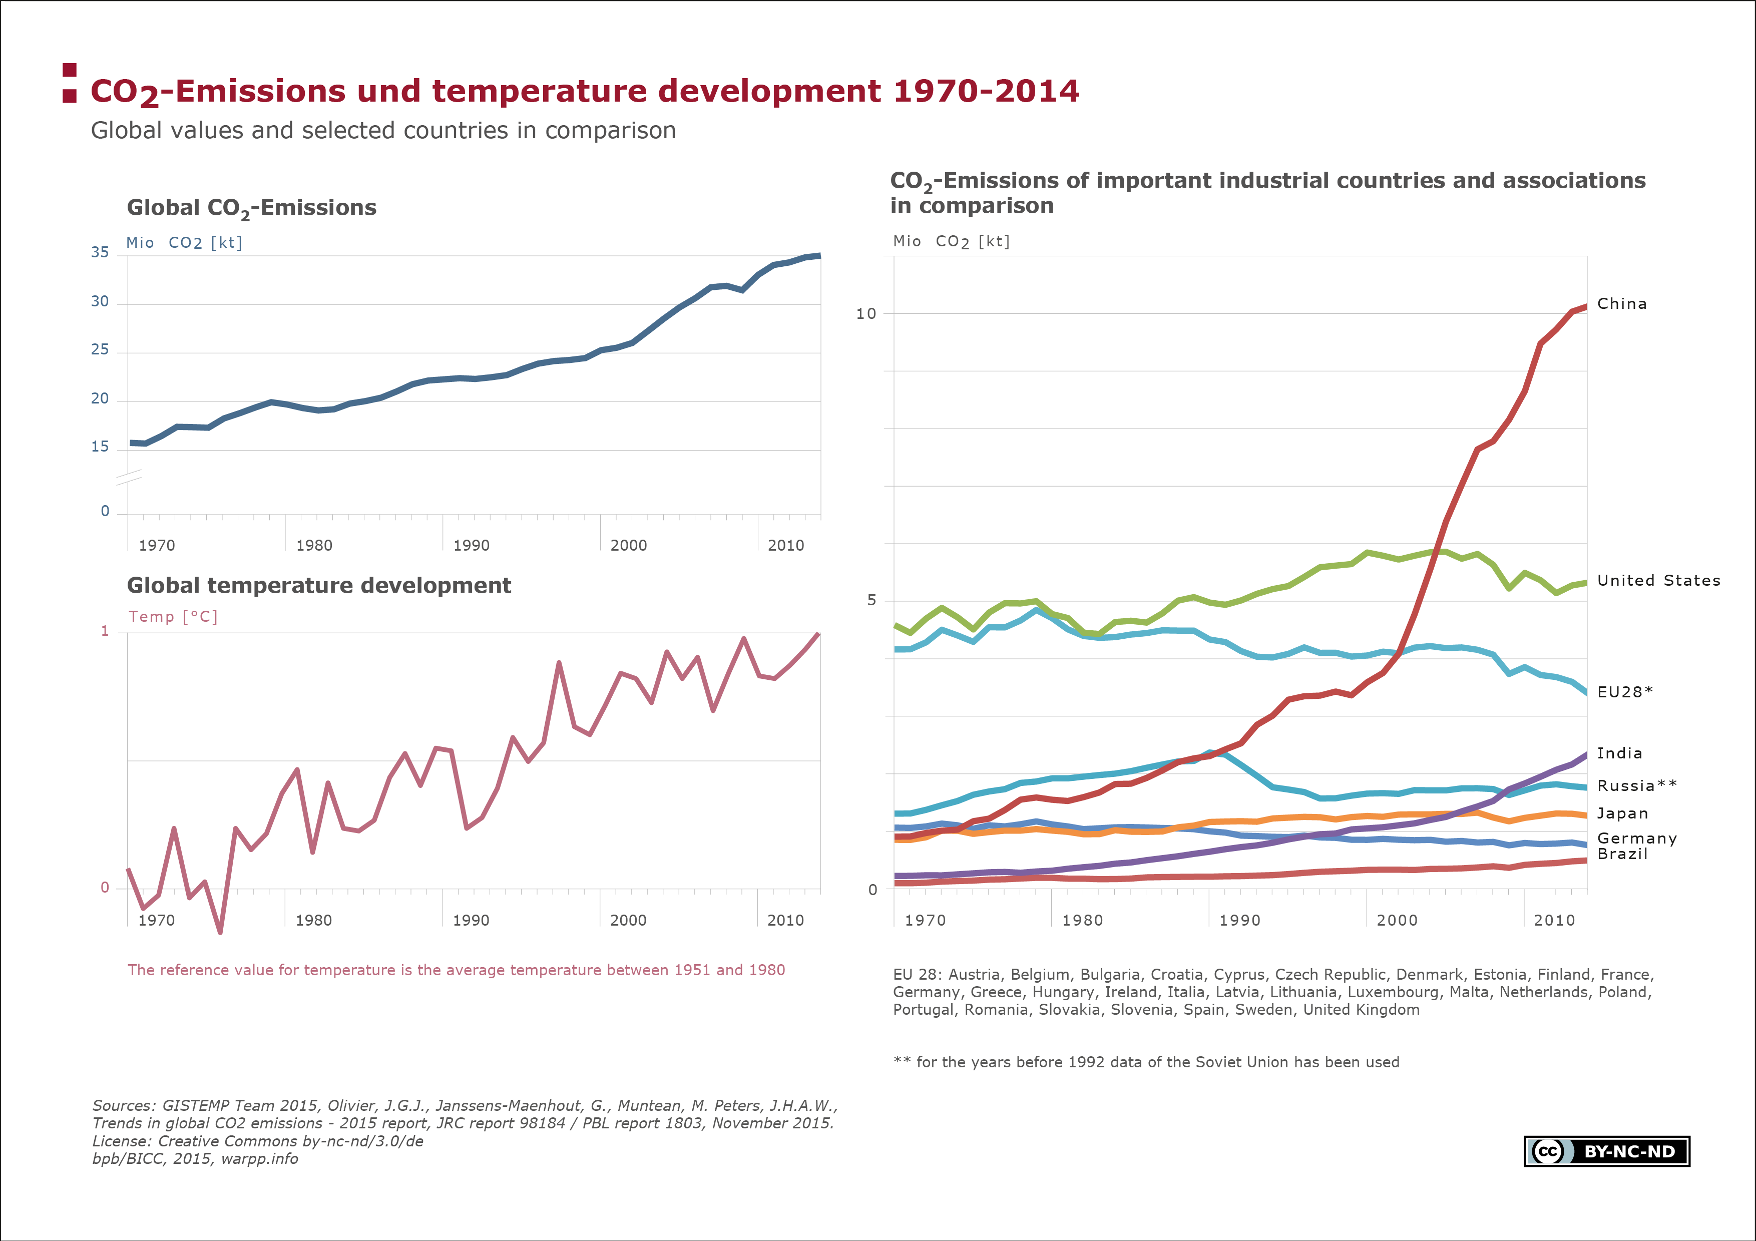
The diagrams show information on the global development of CO2 emissions in the past decades and also compare the emissions of selected industrial and emerging countries. Furthermore, the diagram “Global Temperature Deviations” shows how average temperatures have changed since 1970.
Facts
Since industrialization, global CO2 emissions have increased dramatically and today reach approximately the level of 35 million kilotonnes. While a certain natural amount of CO2 in the atmosphere ensures a climate on earth that supports life, the massive amount of emissions, which primarily arise when fossil fuels are burned, leads to the anthropogenic greenhouse effect. Even if gases such as methane or nitrous oxide have a bigger greenhouse effect, CO2, due to the enormous quantities, is responsible for about 60 per cent of the greenhouse effect caused by humans. On the basis of its population and the size of its economy, Germany is the largest emitter in Europe. In comparison to the countries that emit the most CO2 (China, USA, India and Russia), the absolute CO2 output in Germany has reduced significantly since 1990, and in 2014 annual CO2 emissions were at 767,145 kilotonnes. Germany is therefore responsible for about one-fifth of emissions from the EU-28, followed by Great Britain with 415,420 kilotonnes of CO2.
While the emissions of the EU-28 states, Japan, the USA and Russia are stagnating or, in the case of the EU falling slightly, in the emerging economies, a rise can still be recorded. In a global comparison, the fastest development took place in the People’s Republic of China, which replaced the United States in 2005 as the largest emitter of CO2 and today is responsible for almost one-third of global emissions.
In relation to global temperature changes, the yearly deviation of average annual temperatures in the last few decades can be identified with the help of the diagram. In 2015, the average temperature was 0.96°C higher than in the reference period 1951–1980.
Terms, notes on methodology or reading aids
The data on global surface temperatures are based on calculations from the NASA affiliated institute “Goddard Institute for Space Studies”, which combines historical with modern measurements. On average, the global surface temperature has increased by 0.85°C since industrialization. The last three decades each count as the hottest since the start of measurements being taken.
The colourless and odourless gas, CO2 (carbon dioxide), which forms when fossil fuels are burned as well as during cellular respiration of living organisms, is one of the so-called greenhouse gases which affect the balance of radiation in the atmosphere and therefore have a direct influence on global surface temperatures. Even if the share of CO2 in the atmosphere is extremely low in comparison to other gases, it plays a significant role for the climate and is considered to be the cause of about 60 per cent of the anthropogenic greenhouse effect.
Data sources:
Emission Database for Global Atmospheric Research (EDGAR) The EDGAR database was originally developed for the Dutch Institute for Public Health and Environment (RIVM) and, since 2004, has been continued in cooperation with the European Commission’s Joint Research Centre. The database calculates country emissions of all atmospheric gases, in particular of direct greenhouse gases. The database also contains information on the total emissions of international shipping and air traffic, which together emit approximately the same amount of CO2 as Japan does, which occupies fifth place in the world.
Olivier, J.G.J., Janssens-Maenhout, G., Muntean, M., & Peters, J.A.H.W. (2015). Trends in global CO2 emissions: 2015 Report. PBL Netherlands Environmental Assessment Agency, The Hague; European Commission, Joint Research Centre (JRC), Institute for Environment and Sustainability (IES). http://edgar.jrc.ec.europa.eu/overview.php?v=CO2ts1990-2014&sort=des9
Goddard Institute for Space Studies The Goddard Institute for Space Studies (GISS), founded in 1961, is a NASA research institute based in New York. Since the 1980s, GISS has been counted among the leading research centres worldwide on modelling the atmosphere and climate research, with climate projections for the 21st century being among its key fields. Under the aegis of the long-time director, James E. Hansen, they also developed analyses of global surface temperature variations from various data sets since the 1970s, which constitute a valuable contribution to the exploration of climate change.
GISS Surface Temperature Analysis (GISTEMP) http://data.giss.nasa.gov/gistemp/
Hansen, J., R. Ruedy, M. Sato, and K. Lo, 2010: Global surface temperature change. http://onlinelibrary.wiley.com/doi/10.1029/2010RG000345/full
For a detailed overview of data and data sources, refer to module “Environmental Safety“, sub-categories “Causes of CO2“ and “Global rise in temperature”.
")
")
")