Infographics

image
Infographics

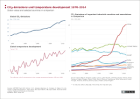
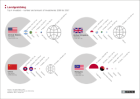
CO2-Emissions und temperature development 1970-2014

The diagrams show information on the global development of CO2 emissions in the past decades and also compare the emissions of selected industrial and emerging countries. Furthermore, the diagram “Global Temperature Deviations” shows how average temperatures have changed since 1970.

More ...
image
Infographics

Rise in sea levels

This chart shows the number of people on the different continents that will be particularly affected by the effects of rising sea levels in 2030. The forecast number of inhabitants by continent is presented here who will live in so-called low-elevation coastal zones (LECZ).

More ...
image
Infographics

Dams worldwide

The diagram gives information on the number of dams as well as the storage volume by continent in 2011. The construction of dams during the 20th century led to protests in many places, which prompted a global debate on the social, ecological and economic sustainability of large dam projects.

More ...
image
Infographics

Land usage footprint of Germany's food production

The diagram shows information on the actual area required for producing food as well as for products for bioenergy and the agro-industry in Germany. This allows the virtual footprint per capita for the consumption of agricultural food and animal feed to be calculated.

More ...
image
Infographics

Land grabbing

The diagram gives information on the four most important countries of origin for large-scale acquisitions of land – often referred to as land grabbing – and their target countries. Since the financial crisis, in particular, investments in land (arable land, forest, nature reserves, etc.) have evolved into much-in-demand investments.

More ...

Buchhandlungen bangen um die Buchpreisbindung

Data tables

For some select map layers, the information portal ‘War and Peace’ provides the user with all used data sets as tables.

More ...
Magnifying Glass in front of a Boston map

Country portraits

In the country reports, data and information are collected by country and put into tables that are used in the modules as a basis for maps and illustrations.

More ...
Compass with Mirror

Navigation and operation

The information and data of each module are primarily made available as selectable map layers and are complemented by texts and graphs. The map layers can be found on the right hand side and are listed according to themes and sub-themes.

More ...