
Dams worldwide
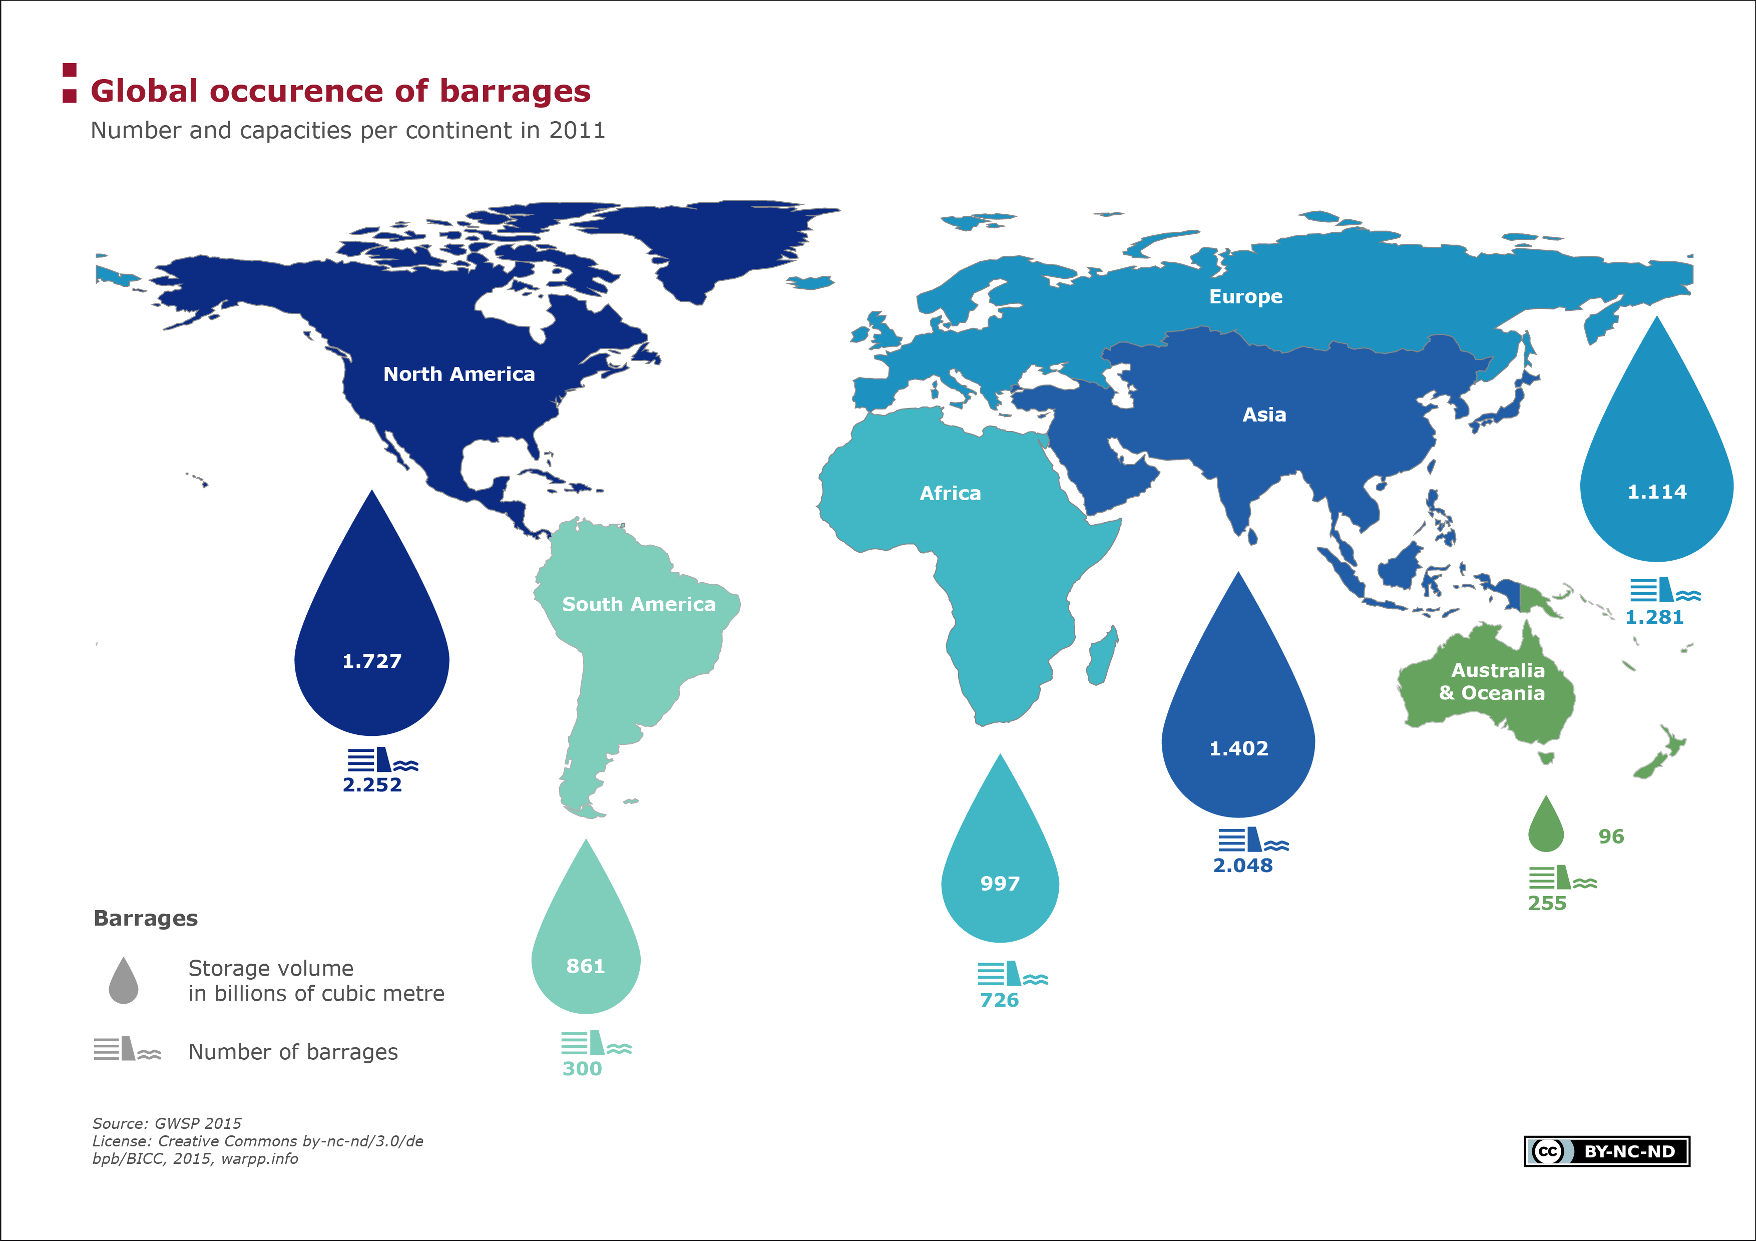
The diagram gives information on the number of dams as well as the storage volume by continent in 2011. The construction of dams during the 20th century led to protests in many places, which prompted a global debate on the social, ecological and economic sustainability of large dam projects.
Facts
The number of large dams rose dramatically in the course of the last century, as these projects were tightly linked with hopes of economic development and modernization. Therefore, many large projects in less-developed countries were financed by the World Bank. These were often accompanied by protests, which drew attention to negative social and ecological effects. While the heyday of dam construction was in the 1970s, even today gigantic projects are still being built and planned. According to estimates, today 30 to 40 per cent of artificially irrigated areas worldwide are due to reservoirs. About half of all rivers are dammed by at least one large dam. Besides irrigation purposes, the production of energy plays an important role – globally almost one-fifth of electricity is produced by hydropower. China, Brazil, the United States and Canada together account for 45 per cent of the hydropower capacity installed worldwide. In Brazil, almost 70 per cent of the entire electricity production is covered by hydropower.
The data shown in the diagram are obtained from the freely available GRanD (Global Reservoir and Dam) database (see below) and take about 6,800 dams with a storage volume of at least 0.1km3 from all over the world into consideration. Alongside this database, there are other databases such as the equally well-known but not freely accessible database of the International Commission on Large Dams (ICOLD), which shows different numbers due to the use of other criteria and definitions.
The largest amount of dams are found in North America, where 2,252 dams contain a total of 1,727 billion m3, followed closely by Asia with 2,048 dams and a total of 1,402 billion m³. About 16 per cent of global dams are located in Europe, whereby a large portion are to be found in water-rich, mountainous countries like, for example, Norway and the Alpine countries. In South America and Africa together, one can find almost 30 per cent of the dams in the world – the large projects to dam the Amazon as well as the Nile have led to fierce protests.
Terms, notes on methodology or reading aids
The data which the diagram are based on include dams with a storage volume of more than 0.1km3. Dams used for energy production, irrigation or water supplies, as well as dams for fishery purposes, flood protection and other purposes are taken into consideration. It should be noted that the database used is not exhaustive (see data sources). The World Commission on Dams (WCD) was set up in the late 1990s with support from the World Bank and the International Union for Conservation of Nature (IUCN). Against the backdrop of continuing protests against large dams worldwide, the WCD was tasked to produce recommendations to reduce the negative ecological and socio-economic consequences of future projects With the help of experts, advocates and opponents of large dams analyzed about 1,000 projects together and recorded the results in a 300-page summary report. A significant point was the failure to involve the local populace in project planning or to compensate them.
Data sources:
Global Water System Project (GWSP) / Lehner et al. – GRanD Database The GRanD (Global Reservoir and Dam) database was built in the course of the Global Water System Project. The latest version contains information on over 6,852 dams worldwide as well as the corresponding reservoirs (from a storage volume of over 0.1km3). In addition to information on the height of the dams, storage volumes and dam’s function, the database also provides information on the dammed river and the corresponding river basin
Lehner, B., C. Reidy Liermann, C. Revenga, C. Vorosmarty, B. Fekete, P. Crouzet, P. Doll, M. Endejan, K. Frenken, J. Magome, C. Nilsson, J.C. Robertson, R. Rodel, N. Sindorf, and D. Wisser. 2011. Global Reservoir and Dam Database, Version 1 (GRanDv1): Reservoirs, Revision 01. Palisades, NY: NASA Socioeconomic Data and Applications Center (SEDAC). http://dx.doi.org/10.7927/H4HH6H08.
Lehner, B., C. Reidy Liermann, C. Revenga, C. Vorosmarty, B. Fekete, P. Crouzet, P. Doll, M. Endejan, K. Frenken, J. Magome, C. Nilsson, J.C. Robertson, R. Rodel, N. Sindorf, and D. Wisser. 2011. High-Resolution Mapping of the World's Reservoirs and Dams for Sustainable River-Flow Management. Frontiers in Ecology and the Environment 9 (9), pp. 494-502. http://dx.doi.org/10.1890/100125.
Global Water System Project (GWSP) – GRanD Database http://sedac.ciesin.columbia.edu/data/collection/grand-v1
For a detailed overview of data and data sources, refer to module “Environmental Safety”, map layer “Dams and Reservoirs”.
")
")
")