Infographics
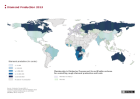
Diamond Production 2013
The map shows the diamond production measured in carat in 2013, and the membership of states in the Kimberley Process.
More ...
The map shows the diamond production measured in carat in 2013, and the membership of states in the Kimberley Process.
More ...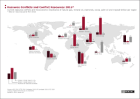
This graphic illustrates the economic importance of natural gas, mineral oil, diamonds, cacao, palm oil and tropical timber, as well as the number of current resource conflicts in thirteen regions of the world in 2013.
More ...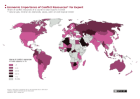
The map illustrates the economic importance of conflict resources (natural gas, mineral oil, diamonds, cacao, palm oil and tropical timber) as share of the total exports of a country for the year 2013.
More ...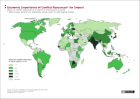
The map illustrates the economic importance of conflict resources (natural gas, mineral oil, diamonds, cacao, palm oil and tropical timber) as share of the total imports of a country for the year 2013.
More ...")
© picture-alliance/dpa
For some select map layers, the information portal ‘War and Peace’ provides the user with all used data sets as tables.
More ...")
© picture-alliance/dpa
In the country reports, data and information are collected by country and put into tables that are used in the modules as a basis for maps and illustrations.
More ...")
© picture-alliance/dpa
The information and data of each module are primarily made available as selectable map layers and are complemented by texts and graphs. The map layers can be found on the right hand side and are listed according to themes and sub-themes.
More ...