Infographics

image
Infographics

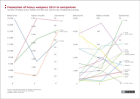
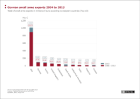
Possession of heavy weapons 2014 in comparison

The figure shows the possession of battle tanks, combat aircraft and submarines by 20 countries in 2014. The first vertical axis shows the number of battle tanks, the second the number of combat aircraft and the third military submarines.

More ...
image
image
image
Infographics

German small arms exports 2013 according to regions of recipient countries

This graph shows the exports of German small arms in millions of euro as well as the paths for possible proliferation The data are broken down by recipient regions The largest small arms exports went to North America, followed by exports to non-EU European countries, closely followed by exports to the Middle East.

More ...
image
Infographics

German small arms exports 2004 to 2013

The graph shows the sum of German small arms exports for 2004 to 2013 exemplary of the top 10 SALW importing countries who showed the highest value of goods for the reported period The red columns show the total of export values for 2004 to 2012; the blue columns the export value for 2013.

More ...
image

Buchhandlungen bangen um die Buchpreisbindung

Data tables

For some select map layers, the information portal ‘War and Peace’ provides the user with all used data sets as tables.

More ...
Magnifying Glass in front of a Boston map

Country portraits

In the country reports, data and information are collected by country and put into tables that are used in the modules as a basis for maps and illustrations.

More ...
Compass with Mirror

Navigation and operation

The information and data of each module are primarily made available as selectable map layers and are complemented by texts and graphs. The map layers can be found on the right hand side and are listed according to themes and sub-themes.

More ...