
On the basis of the Corruption Perceptions Index (CPI), this map layer shows the perception of corruption in five categories for the year 2017. The Index measures the perceived degree of corruption among politicians and officials. In 2016, 176 countries were under review and scored from 0 (perceived as highly corrupt) to 100 points (perceived as little corrupt). The Corruption Perceptions Index is a composite index that is based on different censuses conducted with experts and companies alike, carried out in the last 24 months. For this Index, business people and country analysts are interviewed, and censuses conducted with nationals of a country, whether they live in the country or abroad, are also taken into account.
Corruption Perception Index, bottom 5
This figure shows the five countries with the lowest CPI (perceived as very corrupt).
Sources: Transparency International 2018
Corruption Perception Index, top 5
This figure shows the five countries with the highest CPI (perceived as little corrupt).
Sources: Transparency International 2018
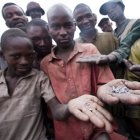
© picture alliance / Yannick Tylle
Strategies and standards for corporate social responsibility
Overexploitation, environmental degradation, wage dumping and human rights violations: To avoid negative effects of natural resources exploitation (extractive industries) or the cultivation of crops (large-scale agricultural production), different actors have to cooperate.
More ...")
")
")